Industrial lighting upgrades can look simple: replace high-bay fixtures, reduce wattage, and wait for savings. The financial reality is less tidy. Electricity tariffs, operating hours, maintenance costs, controls, rebates, and installation access can change the result significantly. This guide explains how to calculate payback period for industrial led upgrade using measurable site data rather than optimistic supplier estimates.
The International Energy Agency reports that lighting represents about 15% of global electricity consumption. Its energy-efficiency analysis also emphasizes efficient lighting and controls as practical ways to reduce electricity demand. The U.S. Department of Energy states that LED products can use substantially less energy and last far longer than traditional lighting technologies. However, industrial comparisons require care. A 150-watt LED may not replace every 400-watt metal-halide fixture without checking illumination levels, beam angles, and mounting height.
The basic calculation is straightforward: net project cost divided by annual net savings. Include fixture costs, labor, lifts, disposal, controls, demand charges, maintenance reductions, and available incentives. A warehouse operating 5,000 hours annually may show strong savings, but a dusty factory could need cleaning or emergency replacements. Real conditions matter.
Payback is only one measure. A longer-life LED system can improve visibility, reduce relamping interruptions, and support safer work areas. Still, assumptions can be wrong. Meter readings may reveal lower operating hours, while utility bills may expose demand charges that were overlooked. These seven practical tips combine field experience, energy-accounting discipline, and evidence from recognized industry sources. The goal is not a perfect forecast. It is a defensible investment decision.
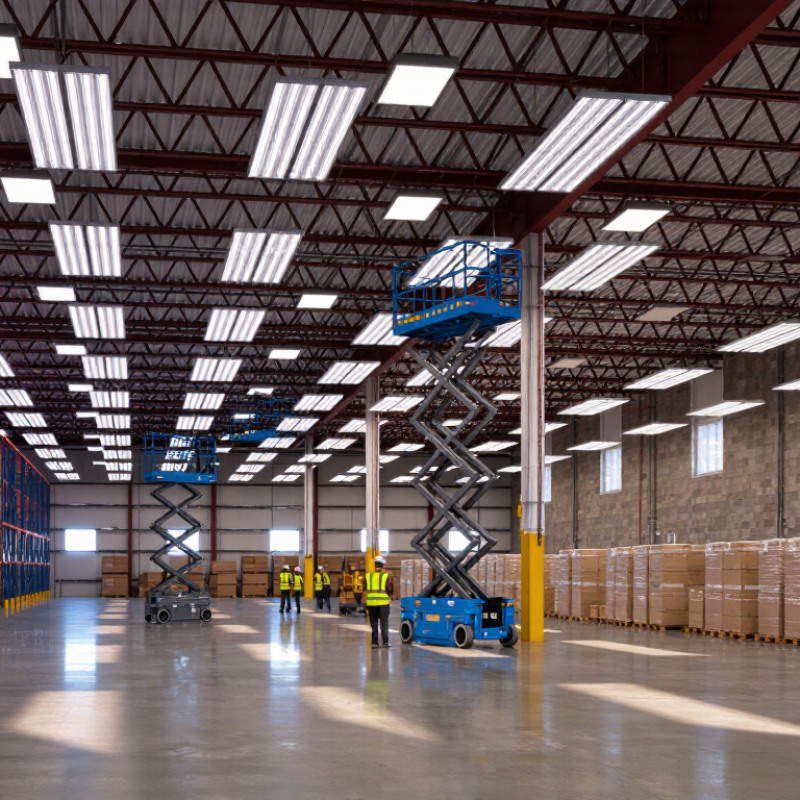
Define the Existing Lighting Baseline and Operating Conditions
7 Tips How to Calculate Industrial LED Upgrade Payback
Define the Existing Lighting Baseline and Operating Conditions
Before estimating payback, document how the existing lighting system truly operates. Record fixture wattage, quantity, measured illuminance, operating hours, and control settings. Do not rely only on old drawings. They are often incomplete.
Walk through the facility during different shifts. Note dark aisles, overlit workstations, dusty lenses, failed lamps, and areas requiring portable lighting. A calibrated lux meter can confirm whether current illumination meets task requirements. Utility bills also reveal seasonal changes and production schedules.
Tip 1: Build a real baseline. Measure lighting loads with a power meter when possible. Then compare those readings with invoices and maintenance records. Small discrepancies matter.
Tip 2: Separate operating conditions by zone. A warehouse may run continuously, while loading docks operate intermittently. Include occupancy sensors, daylight controls, cleaning routines, and lamp replacement time. These details affect savings more than a simple wattage comparison.
A perfect baseline is rarely available. That is normal. Document assumptions clearly, and identify uncertain figures instead of hiding them. For example, a site may estimate annual operating hours from supervisor interviews. Later, a monitoring device may show fewer hours. That correction can change the payback calculation. Reliable analysis comes from measured evidence, practical observation, and honest revision.
Calculate the Full Cost of the Industrial LED Upgrade
7 Tips How to Calculate Industrial LED Upgrade Payback?
Calculate the Full Cost of the Industrial LED Upgrade
A reliable payback estimate starts with a site audit, not a supplier quote. Count every fixture, lamp, mounting height, and operating hour. Record current wattage and measured light levels in each work area. A warehouse may use 240 fixtures, but only 210 may operate during every shift. That difference changes the calculation.
Include purchase, installation, lifts, wiring changes, controls, testing, and disposal fees. Add permits, temporary lighting, freight, and possible production downtime. These costs are easy to overlook. They can delay payback by several months. Ask electricians for written labor estimates, then compare them with recent project invoices. Guesswork is not reliable here.
Calculate annual savings from energy, maintenance, and avoided lamp replacements. Use actual utility rates, demand charges, and seasonal schedules. Check whether sensors will reduce operating hours without affecting safety or productivity. Include cleaning costs and expected service life, but avoid treating optimistic projections as facts. A simple formula is total project cost divided by verified annual savings. Keep a buffer for damaged fixtures, access problems, and price changes. Measure twice. I once underestimated lift rental time because the ceiling layout looked simple on paper. Review the result with a facility manager and finance professional before approving the upgrade.
Industrial LED Upgrade Payback: 10-Year Cumulative Cash Flow
This model uses a 100-fixture industrial facility upgrading from 150 W metal-halide fixtures to 80 W LED fixtures. The estimated full project cost is $34,000, including fixtures, controls, installation, disposal, design, and commissioning. Annual benefits include approximately $3,360 in electricity savings and $1,800 in maintenance savings.
Based on 4,000 operating hours per year and an electricity rate of $0.12 per kWh, the estimated annual benefit is $5,160. The simple payback period is approximately 6.6 years, with the project reaching positive cumulative cash flow during Year 7.
Cost assumptions: LED fixtures $22,000; controls $3,500; installation $6,000; disposal and recycling $1,000; design and commissioning $1,500.
Measure Energy, Maintenance, and Productivity Savings
7 Tips: How to Calculate Industrial LED Upgrade Payback
Measure the baseline before replacing fixtures. Record each lamp’s wattage, operating hours, utility rate, and control schedule. Tip one: use real meter data. The U.S. Department of Energy reports that LED products can use at least 75% less energy than incandescent lighting and last up to 25 times longer. However, industrial sites usually replace fluorescent or high-intensity discharge systems, so applying that figure directly can overstate savings. Compare measured loads instead. Tip two: calculate annual energy savings from actual operating hours. Tip three: include demand charges where applicable.
Maintenance savings need careful evidence. Count relamping labor, lift rental, disposal, spare lamps, and production interruptions. The DOE’s solid-state lighting research identifies longer service life as a major lifecycle advantage, but published life ratings do not guarantee identical performance in dust, heat, or vibration. Inspect the environment. Tip four: discount optimistic maintenance assumptions. Tip five: separate fixture savings from controls savings. Lawrence Berkeley National Laboratory found networked lighting controls produced average savings of about 47% across analyzed commercial projects, though industrial results can differ. Use occupancy sensors only where movement patterns support them.
Productivity is harder to price, yet it should not be ignored. Measure task illuminance, glare, contrast, error rates, and reported visual fatigue before and after installation. The Illuminating Engineering Society recommends evaluating lighting quality, not just wattage. Tip six: run a pilot aisle. Tip seven: calculate simple payback, then test a conservative case with lower savings and higher installation costs. The first estimate may be wrong. That is useful.
Apply the LED Payback Period Formula Step by Step
7 Tips: How to Calculate Industrial LED Upgrade Payback
Apply the LED Payback Period Formula Step by Step
Begin with the existing lighting load. Record fixture quantity, wattage, operating hours, and electricity price. Measure actual conditions when possible. A dusty warehouse may operate longer than maintenance records suggest. Calculate current annual energy cost by multiplying total watts, yearly hours, and the electricity tariff. Divide by 1,000 to convert watts into kilowatts.
Then estimate the upgraded load using the same method. Annual energy savings equal the old energy cost minus the new energy cost. Add realistic maintenance savings, such as fewer lamp replacements and reduced lift equipment use. Subtract installation expenses, controls, rewiring, and disposal charges. The core formula is: payback period equals total project cost divided by annual savings. For monthly payback, divide both figures consistently. Do not mix annual savings with monthly costs.
Use a worked example. A facility spends 12,000 dollars on an upgrade. It saves 3,000 dollars in energy and 1,000 dollars in maintenance each year. Payback equals 12,000 divided by 4,000, or three years. Check operating schedules and demand charges separately. Lighting controls may change the result. My first estimate was too optimistic because I ignored low-production weeks. That mistake mattered. Test one zone, compare meter readings, and revise the calculation before approving the full project. Include expected LED life, warranty terms, light quality, and worker visibility in the decision. Cheap payback can still disappoint.
7 Tips: How to Calculate Industrial LED Upgrade Payback? — LED Payback Period Formula Step by Step
Calculation model:
Energy Savings (kWh/year) = Fixture Quantity × (Existing Wattage − LED Wattage) ÷ 1,000 × Operating Hours.
Annual Total Savings = Annual Energy Cost Savings + Annual Maintenance Savings.
Simple Payback Period (years) = Upgrade Investment ÷ Annual Total Savings.
The examples use representative industrial operating conditions, a carbon factor of 0.40 kg CO₂/kWh, and currency values in USD.
| Step / Facility Area |
Fixture Quantity |
Existing Load
(W/fixture) |
LED Load
(W/fixture) |
Operating Hours
(hours/year) |
Electricity Rate
(USD/kWh) |
Annual Energy Savings
(kWh) |
Annual Energy Cost Savings
(USD) |
Annual Maintenance Savings
(USD) |
Upgrade Investment
(USD) |
Annual Total Savings
(USD) |
Payback Period
(years) |
Avoided CO₂
(metric tons/year) |
| 1. Warehouse aisles |
120 |
250 |
100 |
4,000 |
0.13 |
72,000 |
9,360 |
1,200 |
21,600 |
10,560 |
2.05 |
28.8 |
| 2. Production floor |
180 |
200 |
90 |
4,500 |
0.13 |
89,100 |
11,583 |
6,300 |
30,600 |
17,883 |
1.71 |
35.6 |
| 3. Cold-storage area |
80 |
300 |
150 |
5,000 |
0.16 |
60,000 |
9,600 |
3,200 |
20,800 |
12,800 |
1.63 |
24.0 |
| 4. Outdoor parking |
150 |
150 |
60 |
4,200 |
0.14 |
56,700 |
7,938 |
2,700 |
22,500 |
10,638 |
2.12 |
22.7 |
| 5. High-bay assembly area |
250 |
180 |
80 |
6,000 |
0.12 |
150,000 |
18,000 |
7,000 |
47,500 |
25,000 |
1.90 |
60.0 |
| 6. Maintenance workshop |
60 |
400 |
150 |
3,500 |
0.15 |
52,500 |
7,875 |
3,000 |
15,600 |
10,875 |
1.44 |
21.0 |
| 7. Distribution center |
220 |
240 |
100 |
4,500 |
0.13 |
138,600 |
18,018 |
7,040 |
39,600 |
25,058 |
1.58 |
55.4 |
Important assumptions: Fixture wattage excludes lighting controls unless stated otherwise. Maintenance savings represent avoided relamping, labor, access equipment, and disposal costs. Actual payback will vary with operating schedules, utility tariffs, rebates, lighting controls, installation labor, and site-specific maintenance records.
Check Results with Incentives, Risks, and Sensitivity Analysis
7 Tips: How to Calculate Industrial LED Upgrade Payback
A credible payback model starts with measured operating data. Record fixture counts, wattage, operating hours, utility rates, and demand charges. The U.S. Department of Energy reports that LED lighting uses at least 75% less energy than incandescent lighting and lasts much longer. However, fluorescent-to-LED savings can be smaller. Do not copy residential estimates into a factory model. Use meter readings where possible. Small errors matter.
Calculate annual savings from energy, demand, maintenance, and avoided relamping costs. Then subtract installation expenses, controls, rewiring, and disposal fees. Deduct confirmed rebates before calculating payback. The formula is simple: net project cost divided by annual savings. A factory using 2,000 fixtures for 4,000 hours annually may gain significant savings, but only if the replacement delivers suitable light levels. OSHA guidance requires adequate workplace illumination, so lower wattage alone is not success.
Test the result with sensitivity analysis. Model electricity prices, operating hours, labor costs, rebate timing, and equipment life. The International Energy Agency identifies efficiency as a major source of energy savings, but facility results remain site-specific. Try a conservative case with 20% lower savings and a higher installation cost. Add a risk allowance for production downtime. A spreadsheet may show a 2.8-year payback, yet the project could exceed four years after tariff changes. That uncomfortable gap deserves attention. Recheck assumptions after three months of utility bills. Real performance sometimes disappoints.
FAQS
Record fixture quantity, wattage, measured illuminance, operating hours, electricity rates, and control settings. Do not trust old drawings alone. Walk the facility during different shifts. Note dusty lenses, dark aisles, failed lamps, and portable lighting use.
Actual power readings expose differences between rated and real consumption. Compare meter results with utility bills and maintenance records. Small gaps matter. Estimates can look tidy but remain wrong.
Separate areas by schedule and use. A warehouse may operate continuously, while loading docks run intermittently. Include occupancy sensors, daylight controls, cleaning routines, and lamp replacement time.
Payback period equals net project cost divided by annual savings. Net cost includes installation, controls, rewiring, and disposal. Subtract confirmed incentives before calculating. Keep yearly figures together.
Multiply total lighting watts by yearly operating hours and the electricity tariff. Divide watts by 1,000 to obtain kilowatts. Calculate old and upgraded costs separately. The difference is energy savings.
Yes, include fewer lamp replacements, reduced lift use, and lower maintenance labor. Use realistic costs, not hopeful guesses. Keep invoices nearby.
Model lower savings, higher installation costs, changed electricity prices, and fewer operating hours. Add possible production downtime. A projected 2.8-year payback might become four years. That gap deserves attention.
Review three months of utility bills and compare meter readings with the forecast. Confirm light levels in work areas. Check dark corners and overlit stations. Real performance may disappoint. Revise the model honestly.
Conclusion
Calculating the payback of an industrial LED upgrade begins with a clear understanding of the existing lighting system. Document the number and type of fixtures, wattage, operating hours, electricity rates, maintenance frequency, and current lighting performance. Then estimate the complete upgrade cost, including LED fixtures, controls, installation labor, disposal, project management, and any required electrical improvements. A complete baseline prevents hidden costs from distorting the investment decision.
To understand how to calculate payback period for industrial led upgrade projects, compare the upgrade’s total cost with its annual financial benefits. Include electricity savings, reduced lamp and labor expenses, and measurable productivity improvements caused by better visibility or fewer interruptions. Divide the net project cost by annual savings to obtain the simple payback period. Finally, improve the reliability of the result by considering rebates, financing, warranty coverage, operating changes, energy-price fluctuations, and sensitivity scenarios. This approach helps decision-makers evaluate both the expected return and the risks before approving the project.

 Lijah Light